Between November 23-25, 2024, Bitcoin faced a sharp drop after failing to break the psychological $100K level. After reaching $99K on November 22, its price tumbled to $95K by November 25. This decline didn’t just halt the steady gains seen since November 19 but also reinforced $100K as a major resistance point, making it clear that the bullish trend dominating the market was losing momentum.
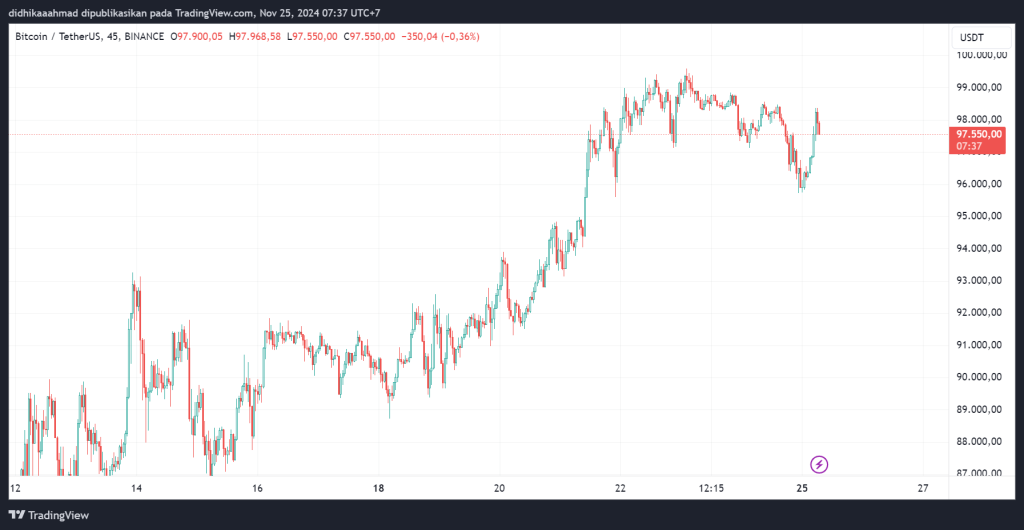
Bitcoin’s climb started on November 19, steadily rising from $87K and hitting new all-time highs (ATHs) every day until November 22. Charts showed a clear ascending channel, which reflected strong optimism across the market. Traders were betting heavily on Bitcoin breaking $100K, but on November 23, things began to shift. Many traders started locking in profits around $99K, leading to a wave of profit-taking that weakened Bitcoin’s upward momentum.
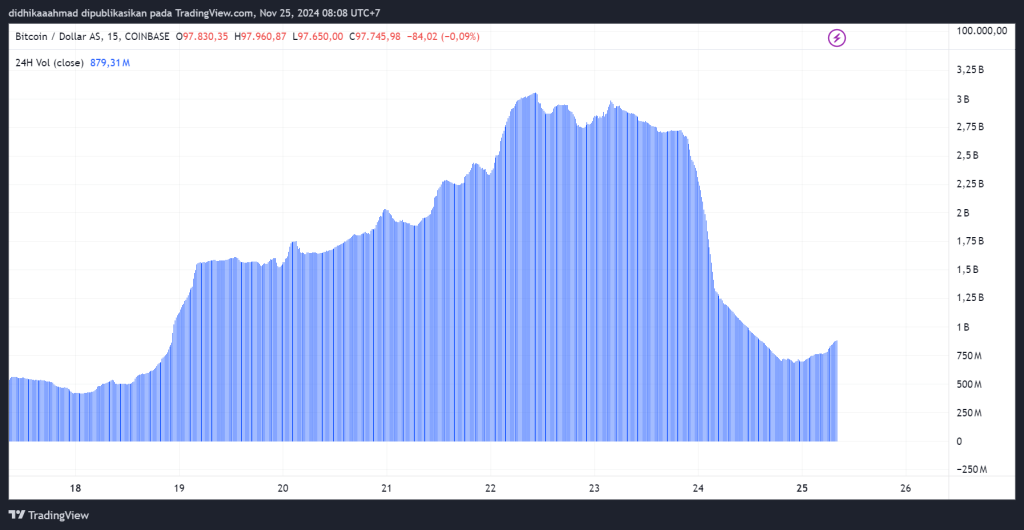
However, the trend shifted on November 23 as profit-taking by large traders began to dominate the market, particularly around the $99K level. Alongside the profit-taking, trading volume experienced a sharp decline. From its peak of over $3.25 billion on November 22, the volume dropped dramatically to below $750 million by November 25.
This steep decline in volume reflected waning momentum and reduced participation in the market, which left Bitcoin more vulnerable to selling pressure. The combination of heavy profit-taking and the significant drop in trading volume underscores the market’s sensitivity to psychological levels like $100K.
Massive Liquidations and Sharp Volume Decline
Over the past 24 hours, the Bitcoin market recorded a total liquidation of $492.96 million, involving 192,943 traders. This wave of liquidations was dominated by long positions, which accounted for $356.95 million, while short positions made up $136.01 million.
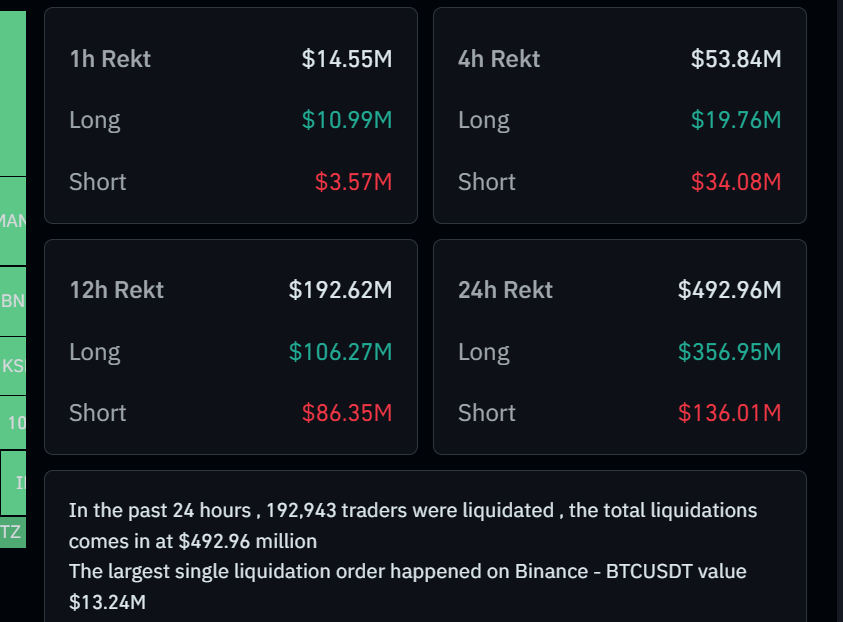
The largest wave of liquidations occurred over a 12-hour period, totaling $192.62 million. Of this, $106.27 million came from long positions, while $86.35 million came from short positions. Much of this pressure arose as Bitcoin’s price dropped from its peak of $99K on November 22 to $97K on November 23.
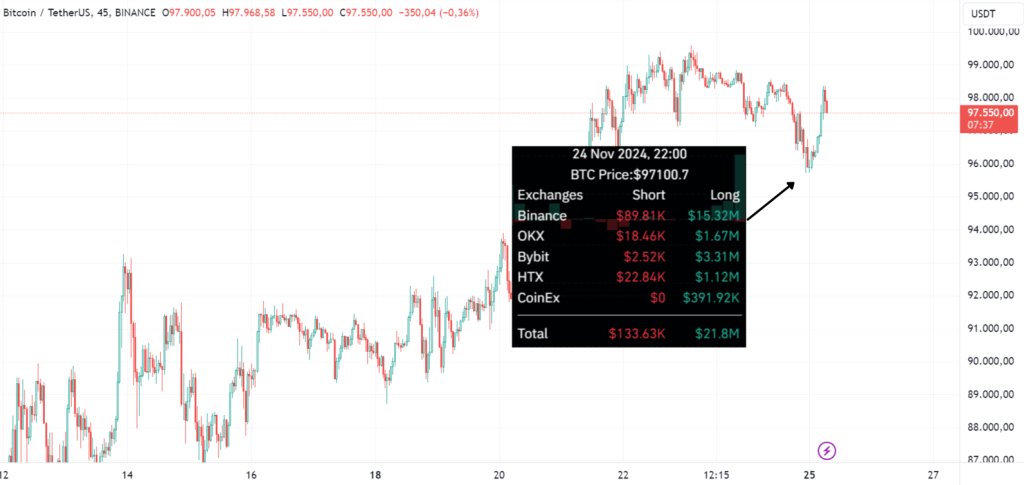
Breaking down the data by exchange, Binance saw the largest liquidation volumes, with $15.32 million in long positions and $89.81 thousand in short positions wiped out. Bybit followed with $3.31 million in long liquidations, while OKX and HTX recorded $1.67 million and $1.12 million, respectively. Even smaller platforms like CoinEx were not spared, with $391.92 thousand in long positions liquidated.
This price drop was further exacerbated by a dramatic decline in Bitcoin’s trading volume. From its peak of $3.25 billion on November 22, trading volume plunged below $750 million by November 25. The combination of massive liquidations and the steep decline in trading volume accelerated Bitcoin’s downward trajectory, showing how a lack of volume can leave the market more vulnerable during significant pressure points, especially at critical levels like $100K.
Related Crypto liquidations cross $500 million in past day as bitcoin’s price falls to $96,000
Bitcoin or Altcoins? The Tug of War in Market Dominance
Between November 23-25, 2024, Bitcoin Dominance (BTC.D) went on a rollercoaster ride amidst a major sell-off in the cryptocurrency market. Starting at 60.5% on November 22, BTC.D dropped to 59.34% on November 24, signaling a shift as traders poured their funds into altcoins during Bitcoin’s price dip. However, by November 25, BTC.D climbed back up to 59.58%, suggesting that Bitcoin wasn’t ready to give up its lead just yet.
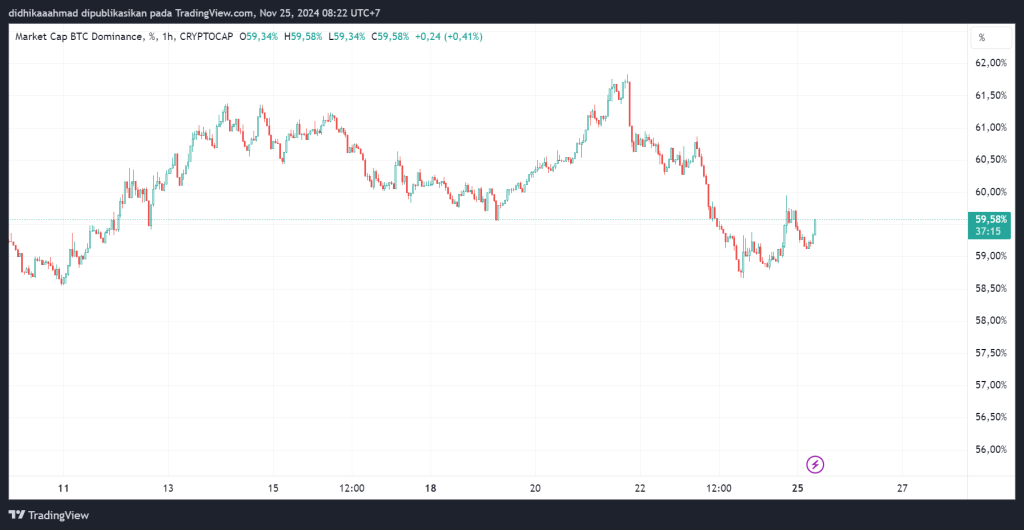
So, what exactly is BTC.D? Bitcoin Dominance measures Bitcoin’s share of the total cryptocurrency market capitalization. When BTC.D rises, it shows that investors are leaning more towards Bitcoin, often as a “safe bet” during market uncertainty. On the other hand, a dip in BTC.D signals growing interest in altcoins, which, although riskier, can offer higher potential returns during bullish periods.
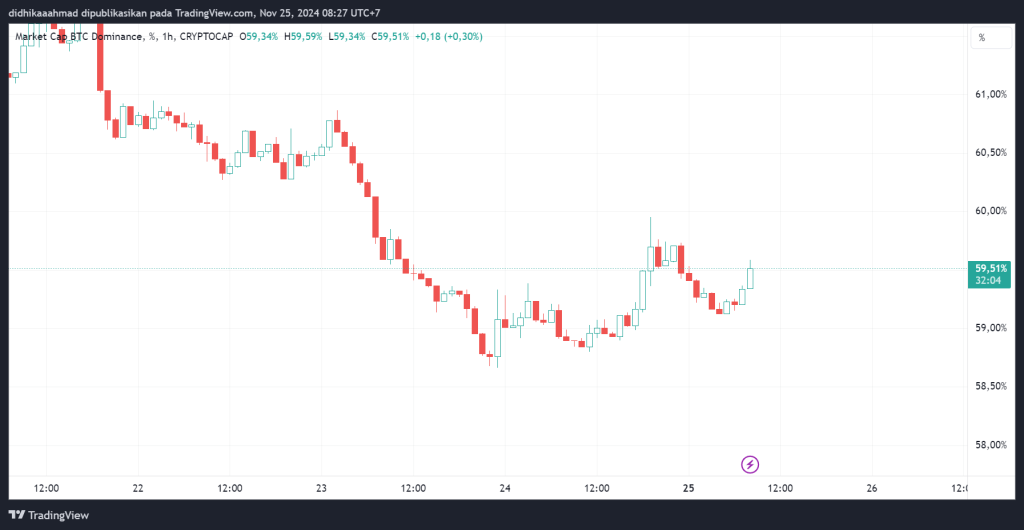
The dip in BTC.D to 59.34% on November 24 suggests that altcoins gained traction as Bitcoin faced selling pressure near the $100K mark. Yet, the subsequent rise to 59.58% on November 25 shows that Bitcoin still holds its ground as the go-to asset, especially when the market starts to calm down.
BTC.D isn’t just a number! it’s a key indicator of how traders and investors are shifting their capital. Its fluctuations can hint at big market movements, whether Bitcoin is reclaiming its throne or altcoins are stealing the spotlight.
Bitcoin Dominance Declines as Stellar Shines, But Focus Returns to Bitcoin
The drop in Bitcoin Dominance (BTC.D) from 60.5% on November 22 to 59.34% on November 24 signaled a shift in capital from Bitcoin to altcoins during the market correction. When BTC.D decreases, investors tend to explore opportunities in altcoins with higher potential returns, albeit with greater risks.
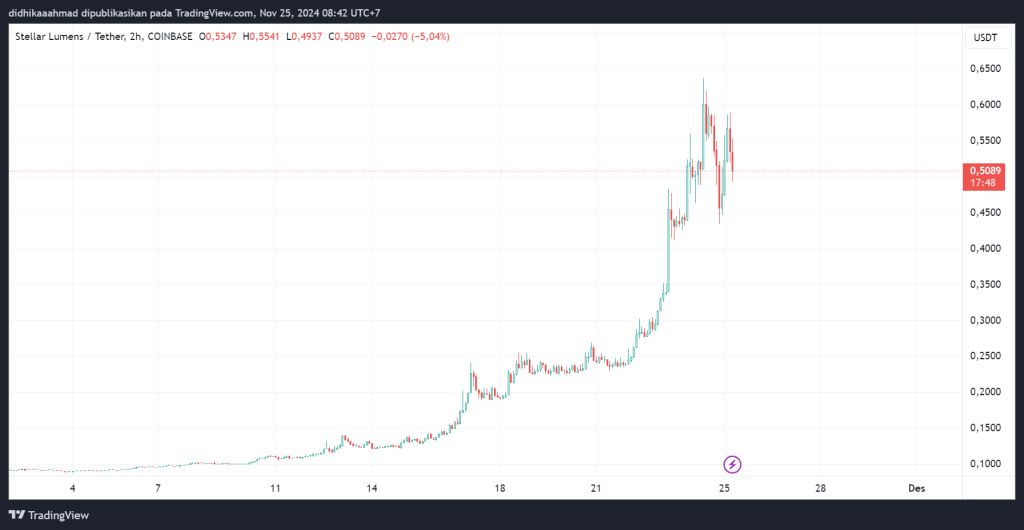
One altcoin that stood out during this period was Stellar (XLM). Its price surged from $0.1 on November 12 to $0.6 on November 24, marking a 500% increase in less than two weeks. This remarkable rise highlights the strong interest from investors in altcoins perceived as undervalued and offering significant growth potential, particularly when Bitcoin faced selling pressure near the psychological $100K level.
The sharp increase in XLM’s price demonstrates how altcoins can shine during times of uncertainty in the broader crypto market. However, as BTC.D rebounded to 59.58% on November 25, the trend indicated that the market was refocusing on Bitcoin. This reflects investors’ confidence in Bitcoin as the primary and more stable asset amidst market volatility.
You can also read this Exploring Stablecoins, The Pillars of the Crypto Ecosystem
[Editor’s Note: This article does not represent financial advice. Please do your own research before investing.]


